Maps of Numbers
One of the biggest details of making maps is the art of storing places as numbers. Let’s explore it.
The most common way to store places is to picture the Earth as a sphere and store the angles from the top and meridian to your feature. These we store as latitude and longitude, as numbers between -180° and 180° for longitude, and between -90° and 90° for latitude.
A Non-Sphere World
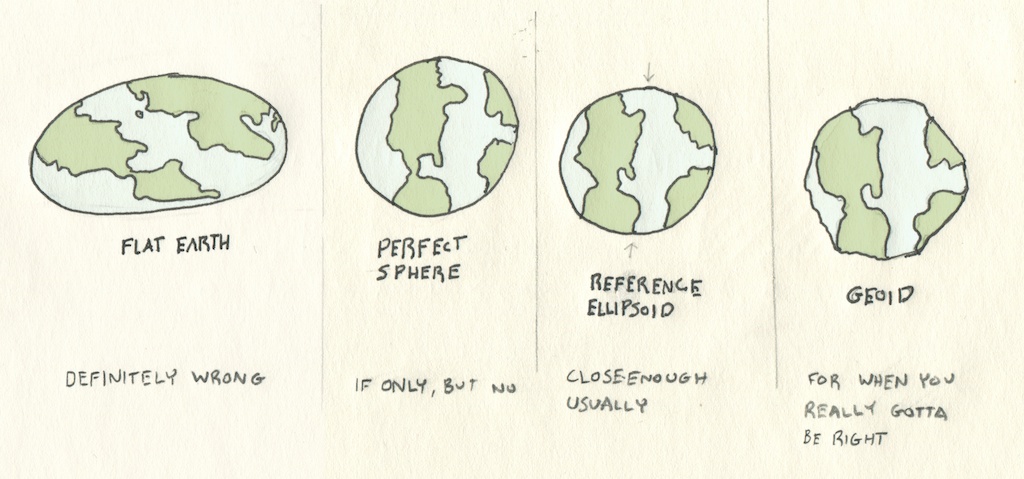
The first sign of trouble is that the earth isn’t a sphere. An ellipse is a closer approximation1. So, our system for latitude and longitude uses an ellipse that’s 42 kilometers wider than it is tall. The WGS84 standard declares the specifics so everyone’s conversions to and from latitude and longitude units match.
Precision & Accuracy
Before we dive into the next level of systems, a quick refresher in the scientific terms precision and accuracy. These make ‘correctness’ a little bit more specific and useful. Precision is the reproducibility of a measurement: if you hop on a scale and see 160.0 lbs, and try it again, and see 160.0 lbs on the dot as many times as you try, you have a high precision scale. Accuracy, on the other hand, is the degree of closeness to the real value. If that extremely precise scale is showing 160.0 lbs, but you weigh 200, it’s inaccurate.
Numbers
Computers store everything as numbers, and geographical data is no different. So the first question you might have is: how precise can geographic data be? 37,-94 is a point in the United States, and 40.24,-76.86 is a point in Pennsylvania and 40.267435,-76.888504 is a point in Harrisburg, but at what point can we stop differentiating between a point in one place and another?
The answer lies in the way that computers encode numbers and in the numerical stability of the code that turns those numbers into places on a map or places in other coordinate systems.
Let’s talk about numbers.
Click a 0 to change the binary number.
Integers are pretty simple: given a number of bits, you flip them to 1 or 0. The value of each bit is 2position from left. If you only have two bits, then 00 is 0, 01 is 1, 10 is 2, and 11 is 3. Given three bits, 100 is 4, since 22 = 4. And so on.
But places on a map usually have a decimal point, so they’re stored as floating point numbers, not as integers.
Floating point numbers are a bit more complex, and more confusing, because they’re really stored as little equations. It’s a very clever system that makes storage of very large and very small values equally possible, but at the same time makes for unusual properties - while it’s easy to say that the number after 2 is 3, the number after 2.00001 is not necessarily 2.00002. The gaps between where you can represent one value and another value are different for different numbers and scales.
This funniness in floating point representation is why my statistics code uses a fancy sum algorithm, and why JavaScript’s floating-point-only numbers get a lot of interest.
GeoJSON and the JSON format underneath it represents numbers as floating point, but this isn’t true for all geospatial formats: geobuf and encode polylines both store coordinates in fixed precision - meaning they’re stored as integers representing the number multiplied by a factor of 5 or 6.
The Spaces Between Places in Lines
Geographic data isn’t just points - it’s also lines and polygons. While points can be mathematically transformed between different spaces without much issue, lines and polygons are different - in the space between points on lines, the line we interpolate is based on the projection system. For instance, the interpolated line between points in the Mercator projection is a rhumb line. A line from the center of an azimuthal projection will form a great circle.
So a line from A → B is really better called a line from A → B in a specific coordinate plane. In order to preserve this line in other coordinate planes, there is a way - by resampling lines and shapes, you add extra ‘implied’ points between points that will be reprojected whenever the data is reprojected. It’s not a perfect trick, but it’s a good step.
Everything Keeps Moving
Not only is the Earth not a perfect sphere or ellipse, it also hasn’t stopped forming. Continental drift continues moving GPS measurements by centimeters a year, as NASA records. By cutting up the world into local coordinates that are relative to spots on the same plates, we could be increasing future accuracy, but that isn’t usually the case. For true global measurements, there’s the International Terrestrial Reference Frame, which stores XYZ coordinates in 3D space and issues updates for tectonic movement.
Projected Math
Local projections are handy for calculations: if they cover a limited area, the units can be in actual feet or meters already, so calculating real-world distance is just a simple euclidean distance rather than the tricky Haversine formula. The same goes for calculating area and other spatial statistics.
This handiness is one of the major reasons why people use local projections, especially when they don’t have lots of computing power - it takes math to ‘reproject’ coordinates from one system to another. But less and less is this a real bottleneck relative to actually running calculations and displaying results.