Understanding Map Projections
Beware: this is a post about opinions and concepts, rather than about releasing software or learning about things. And, while I am a ‘professional’, I’m a software developer first and a neogeographer second, and have yet to print out a map.
What are Map Projections?
Chastising the Spanish artist for painting unrepresentative cubistic abstractions, a layman withdrew a photograph of his wife from his pocket and held it up to Picasso with the admonition, “Why can’t you paint realistically, like that?” “Is that what your wife really looks like?” Picasso asked. “Yes,” replied the man. “Well, she’s very small, and quite flat.”
Dorion Sagan, in Dazzle Gradually
Map projections are _creative ways to represent a three-dimensional world as a differently-shaped thing, usually something flat - so you can print or pan out your map. They’re compromises between different sorts of accuracy and usefulness.
Even if one were to reject projections entirely and go into space to take a gander at the real thing, they could only see one side of the world at a time - a disadvantage relative to your common world map.
So you always lose something in abstractions. Projections are a trade between distortion, accuracy, and aesthetics. Some projections wildly distort all paths except for one, like Craig retroazimuthal. Others only show part of the globe, like the orthographic or general perspective. And still others will wildly distort the size of things on the earth, like mercator, the familiar face of MapBox and Google Maps.
You can’t get it all: thanks to the Theorema Egregium, we know that projections from a sphere to a 2D surface will always distort either directionality or area.
Projections are Old

Map projections are about as old as paper maps, though the modern ‘science of cartographic projections’ is a work in progress.
This matters: the ‘Mercator projection’, invented by Gerardus Mercator around 1569, was a hit because it’s useful for sailing: it preserves angles, a property known as conformality. Sea voyaging was a big deal, and having a map with which you could draw a line from one place to another and sail that path without hitting a continent was pretty useful.
Projections are New
It turned out that a variant of the Mercator projection, what we call spherical mercator, not only had this property, but also is really easy to calculate: here’s an implementation in Javascript:
function lonlat_to_meters(ll) {
    var A = 6378137, D2R = Math.PI / 180;
    return [
        A * ll[0] * D2R,
        A * Math.log(Math.tan((Math.PI*0.25) + (0.5 * ll[1] * D2R)))
    ];
}
Sure, this loses critical aspects of traditional cartography: not only does it distort scale, it treats the Earth as a sphere, when it’s more the shape of a squashed, dimpled ball.
But technology is a result of its environment and requirements, not any absolute value: spherical mercator fits the role of a simple, fast, pannable, and zoomable projection like no other common projection.
Much like how the original mercator projection was developed for sea voyages, the projection that we now use is developed for web maps, and carries the marks of that purpose. In a future where dynamic morphing of data is cheap and 3D is the standard, it might seem outdated - but it will still be no more or less right than any other choice.
So maps need to be zoomable: this would be nonsense twenty years ago, but is vital today. The value of Google Maps is not in its whole-earth view, but when it’s zoomed up to street or province level, where it looks pretty darn good. And maps that don’t zoom on the internet are considered broken: user expectations are set hard by our constant scroll-wheeling and pinching to think that anything that could get closer should. This forces modern cartographers to re-weight the importance of global views versus local, and rethink styling.
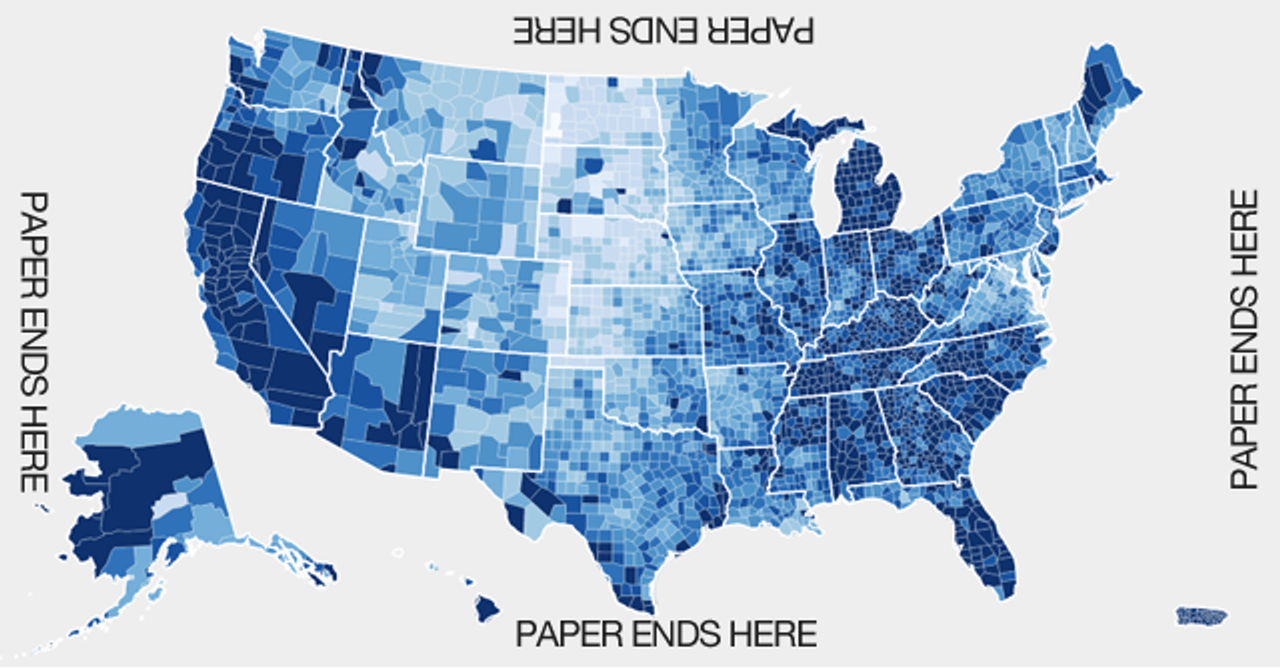
And they’re typically pannable. There are beautiful projections, like the Albers projection, with beautiful implementations, like the one above from d3, an incredible visualization library. But one can feel the influence of paper: what happens at the edges? Where is the context? Of course, in the age of posters in offices and printouts for GIS class, it doesn’t matter if the world ends at the corners of the US or New Jersey.
And projections like Albers do indeed continue, but not quite like you’d expect: sometimes sweeping up the edges of the page instead of continuing horizontally as you scroll.
The sum of this change is that currently conformality, that aspect of preserving direction that spherical mercator handles deftly, is possibly the highest priority for the majority of web maps.
But these requirements are based on the current state of technology: that square tiles, of size 256x256, are the way that people get maps. And that the map one person sees is the the one everyone else does. These restrictions are based on technological hurdles that are likely to fade: MapsGL is the first ‘production’ vector web map, and Apple is rumored to be working on ‘napkin maps’ that are tailored to one specific route. It’s likely that driving directions will no longer show extraneous roads, or that the projection you see zoomed-out, looking at the entire world, is the same one as you see close-up.
This is the first quick bit I’m going to write on projections. Hopefully the rest will follow with this little projection toy - trying to make this subject area more approachable in a creative way.